Your advertising privacy

With your permission, we use the Meta Pixel to measure our Facebook and Instagram ads and improve who sees them. Meta receives page visits, completed enquiry events, your IP address and browser information, and may set advertising cookies. Your form answers are not sent. How Meta uses data

We remember this choice for 180 days. Meta's first-party advertising cookies can last up to 90 days. Rejecting stops future events and removes those cookies here; it does not erase data already received by Meta. Change your choice at any time in Privacy settings. Proptonomy privacy policy

Proptonomy Research

Short-term rental operations and the field team, 2026

How much coordination the work takes, how many tools it runs on, what the people cost and how scarce they are. Twenty figures from official statistics, vendor surveys and platform rules.

20 statistics · 8 publishers · Published 23 September 2026 · Every source re-read 23 September 2026

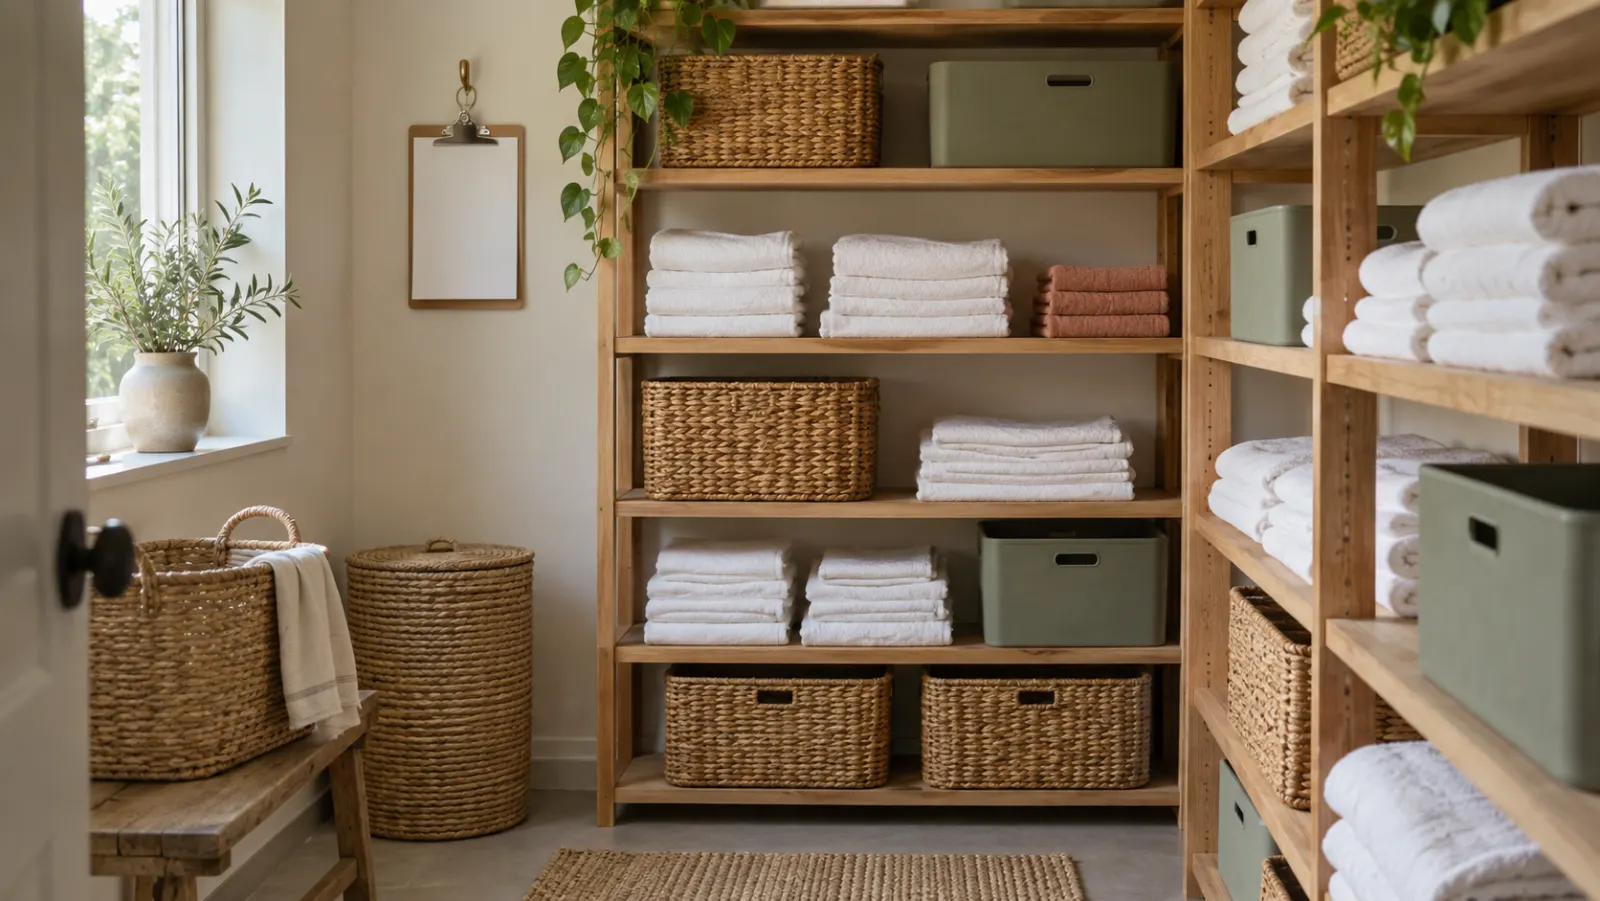
A tidy linen storage room with folded white sheets and towels on oak shelves.
Illustration.

The job is coordination

What this means for operators

Fifty-plus tasks a week, last-minute issues every day, and nine in ten saying the job is constant coordination. The bottleneck is not doing the work, it is keeping everyone told.

  • Vendor survey · n = 350+ hospitality professionals, 23 countries

    73%

    73% of short-term rental operators complete more than 50 tasks per week.

    73% of operators complete more than 50 tasks per week.
    Breezeway, The State of Work in 2025: Short-Term Rentals Statistics and Insights from Operators (2025 State of Work Report)

    Published 2025-09-09 · Read 23 September 2026

    Scope: Vendor survey by Breezeway (operations software); respondents are operators, cleaners, maintenance techs and managers in 23 countries; sampling method not published on the public page.

  • Vendor survey · n = 350+ hospitality professionals, 23 countries

    45.5%

    45.5% of operators run into last-minute guest issues every day.

    Nearly half (45.5%) encounter last-minute guest issues every single day.
    Breezeway, The State of Work in 2025: Short-Term Rentals Statistics and Insights from Operators (2025 State of Work Report)

    Published 2025-09-09 · Read 23 September 2026

    Scope: Vendor survey by Breezeway (operations software); respondents are operators, cleaners, maintenance techs and managers in 23 countries; sampling method not published on the public page.

  • Vendor survey · n = 350+ hospitality professionals, 23 countries

    90%

    90% of short-term rental professionals say their work involves constant coordination with other people.

    90% say their work involves constant coordination with other people.
    Breezeway, The State of Work in 2025: Short-Term Rentals Statistics and Insights from Operators (2025 State of Work Report)

    Published 2025-09-09 · Read 23 September 2026

    Scope: Vendor survey by Breezeway (operations software); respondents are operators, cleaners, maintenance techs and managers in 23 countries; sampling method not published on the public page.

  • Vendor survey · n = 350+ hospitality professionals, 23 countries

    85.5%

    85.5% of operators say guest expectations have risen over the past two years; 79% say owner expectations have too.

    85.5% of operators say guest expectations have increased over the past two years. 79% say owner expectations have also risen.
    Breezeway, The State of Work in 2025: Short-Term Rentals Statistics and Insights from Operators (2025 State of Work Report)

    Published 2025-09-09 · Read 23 September 2026

    Scope: Vendor survey by Breezeway (operations software); respondents are operators, cleaners, maintenance techs and managers in 23 countries; sampling method not published on the public page.

  • Vendor survey · n = 350+ hospitality professionals, 23 countries

    47.8%

    47.8% of operators say more than half of their workflows are already automated.

    Nearly half of operators (47.8%) report that more than half of their workflows are already automated.
    Breezeway, The State of Work in 2025: Short-Term Rentals Statistics and Insights from Operators (2025 State of Work Report)

    Published 2025-09-09 · Read 23 September 2026

    Scope: Vendor survey by Breezeway (operations software); respondents are operators, cleaners, maintenance techs and managers in 23 countries; sampling method not published on the public page. Self-assessed automation level.

  • Vendor survey · n = 350+ hospitality professionals, 23 countries

    3.6%

    67% of operators expect AI to change their jobs in the next few years, but only 3.6% fear it will replace their role.

    67% of operators believe AI will change their jobs in the next few years. Only 3.6% fear AI will replace their role.
    Breezeway, The State of Work in 2025: Short-Term Rentals Statistics and Insights from Operators (2025 State of Work Report)

    Published 2025-09-09 · Read 23 September 2026

    Scope: Vendor survey by Breezeway (operations software); respondents are operators, cleaners, maintenance techs and managers in 23 countries; sampling method not published on the public page.

Too many tools, not enough connection

What this means for operators

Thirteen integrations and up to ten channels per operator: the job has shifted from doing things to carrying information between systems. That carrying is the part software should take.

  • Vendor claim · n = 2,248 accounts

    13

    Vacation rental operators run an average of 13 operational software integrations, plus 6 to 10 listing channels.

    this dataset shows vacation rental operators use an average of 13 operational integrations. This ranges from approximately 11 at the 1–5 property tier to 18 at the 51–100 tier. This excludes OTA connections to Airbnb, Booking.com, Vrbo, and other listing channels, which add another 6–10 active distribution integrations on average.
    Hostfully, Vacation Rental Tech Stack Report 2026

    June 2026 (data as of May 2026) · Read 23 September 2026

    Scope: Only Hostfully PMS customers that met activity and growth filters. Integrations are not the same as distinct tools, and tools native to Hostfully are undercounted.

  • Vendor claim · n = 2,248 accounts

    88%

    Cleaning and turnover software use rises from 52% of operators with 1-5 properties to 88% of those with 100+.

    Hostfully, Vacation Rental Tech Stack Report 2026

    June 2026 (data as of May 2026) · Read 23 September 2026

    Scope: Hostfully customer base only; adoption measured as at least one active integration in the category.

  • Vendor survey · n = 554 hosts

    45.1%

    Rising operating costs hit 45.1% of short-term rental hosts and managers in 2025.

    Rising operational costs affected 45.1% of hosts and managers, while 44.6% reported reduced guest demand or shorter stays.
    Hospitable, Hospitable 2026 Industry Report

    January 2026 (survey fielded November 2025) · Read 23 September 2026

    Scope: Vendor survey of self-managers, co-hosts and property managers; mostly Hospitable's audience.

  • Vendor survey · n = 554 hosts

    89.9%

    89.9% of hosts call property management software essential; 71.3% say the same of dynamic pricing and 48.9% of smart locks.

    In the survey, 89.9% of respondents said property management software is an essential tool, alongside dynamic pricing tools (71.3%) and smart locks (48.9%).
    Hospitable, Hospitable 2026 Industry Report

    January 2026 (survey fielded November 2025) · Read 23 September 2026

    Scope: Vendor survey (a PMS vendor asking about PMS importance). Stated attitudes, not measured usage.

The people are scarce and valuable

What this means for operators

Cleaners are hard to find and hospitality staff leave at nearly twice the average rate. In Norway labour costs 41% more than the EU average, so every hour spent relaying messages is expensive.

  • Official statistics

    $17.07

    US maids and housekeeping cleaners earned a median $17.07 an hour ($35,510 a year) in 2025, across 860,670 jobs.

    OEUN000000000000037201208 (Hourly median wage, Maids and Housekeeping Cleaners, all industries, national) 2025 Annual => "17.07" ; OEUN000000000000037201213 (Annual median wage) => "35510" ; OEUN000000000000037201201 (Employment) => "860670"
    US Bureau of Labor Statistics, Occupational Employment and Wage Statistics (OEWS), SOC 37-2012, via BLS Public Data API

    OEWS 2025 estimates · Read 23 September 2026

    Scope: US national, all industries, excluding self-employed. Quote is the API data cell; series codes checked against BLS oe.datatype and oe.occupation files. OEWS estimates normally refer to May of the reference year. bls.gov HTML pages block automated retrieval, so the API was used.

  • Official statistics

    415,160

    US traveler accommodation employs 415,160 maids and housekeeping cleaners, at a median $16.79 an hour.

    OEUN000000072110037201201 (Employment, Maids and Housekeeping Cleaners, industry 721100 Traveler Accommodation) 2025 Annual => "415160" ; OEUN000000072110037201208 (Hourly median wage) => "16.79" ; OEUN000000072110037201213 (Annual median wage) => "34920"
    US Bureau of Labor Statistics, Occupational Employment and Wage Statistics (OEWS), industry 721100 Traveler Accommodation, via BLS Public Data API

    OEWS 2025 estimates · Read 23 September 2026

    Scope: NAICS 7211 includes hotels, motels and other traveler accommodation; most short-term rental cleaners are contractors or self-employed and are not captured here.

  • Official statistics

    3.5%

    US accommodation and food services workers quit at 3.5% a month in July 2026, nearly double the 1.9% rate across all nonfarm jobs.

    JTS720000000000000QUR (Quits rate, Accommodation and food services, seasonally adjusted) 2026 July => "3.5" [P, preliminary] ; JTS000000000000000QUR (Quits rate, Total nonfarm) 2026 July => "1.9" [P, preliminary]
    US Bureau of Labor Statistics, Job Openings and Labor Turnover Survey (JOLTS), via BLS Public Data API

    July 2026 data (preliminary) · Read 23 September 2026

    Scope: Preliminary, seasonally adjusted; subject to revision. Industry code 720000 (Accommodation and food services) checked against the BLS jt.industry file. Job openings rate for the same industry: 4.5% vs 4.4% total nonfarm.

  • Official statistics

    NOK 43,790

    Full-time cleaners in Norway earned an average NOK 43,790 a month in 2025, about 68% of the all-occupation average (NOK 64,650).

    Average | Cleaners and helpers in offices, hotels and other local kinds of activity units | Sum all sectors | Both sexes | Full-time employees | Monthly earnings (NOK) | 2025 => 43790 ; Average | All occupations | [...] | 2025 => 64650 ; Median | Cleaners and helpers [...] | 2025 => 41930
    Statistics Norway (SSB), Table 11418: Monthly earnings, by measuring method, occupation, sector, sex, contractual/usual working hours per week

    Table updated 2026-08-28 · Read 23 September 2026

    Scope: Norway, full-time employees, occupation code 9112 (all sectors, both sexes). SSB publishes basic salary, variable allowances, bonus and overtime as separate components; this is the 'Monthly earnings' measure. Employees only, not self-employed cleaners. Retrieved via the SSB API v0 (data.ssb.no/api/v0/en/table/11418).

  • Official statistics

    EUR 29.5

    Hourly labour costs in Norway's accommodation and food service sector were EUR 29.5 in 2025, 41% above the EU average of EUR 20.9.

    lc_lci_lev | Euro | Labour cost for LCI (compensation of employees plus taxes minus subsidies) | Accommodation and food service activities | Norway | 2025 => 29.5 ; [...] | European Union - 27 countries (from 2020) | 2025 => 20.9
    Eurostat, Labour cost levels by NACE Rev. 2 activity (dataset lc_lci_lev)

    Dataset updated 2026-04-23 · Read 23 September 2026

    Scope: Euro values are sensitive to NOK exchange rates. The Denmark value in the same dataset (EUR 7.3) looks anomalous, so no Nordic peer comparison is drawn.

  • Official statistics · n = 13,119 businesses

    3,150

    Norwegian accommodation and food service businesses report a shortage of about 3,150 workers in 2026.

    Tabell 5. Estimert mangel på arbeidskraft, etter næring. 2026 [...] Overnattings- og serveringsvirksomhet | 3150 | 2385 | 3894
    Nav (Norwegian Labour and Welfare Administration), Navs bedriftsundersøkelse 2026 - Figurer og tabeller (Tabell 5)

    Published 2026-05-20 · Read 23 September 2026

    Scope: Estimated unfilled demand at survey time (Jan-Mar 2026), all of Norway; covers hotels and restaurants as well as rentals. Nav also estimates a shortage of 450 'renholdere i bedrifter' (commercial cleaners) across all industries (Tabell V2). National total shortage: 34,000; Vestland (Bergen) has the largest county shortage, 6,300.

  • Official statistics · n = 13,119 businesses

    21.7%

    21.7% of Norwegian accommodation and food businesses either failed to recruit or had to hire someone less qualified, against 18.1% across all industries.

    Figur 7. Virksomheter som har mislykkes i å rekruttere eller måtte ansette noen med lavere eller annen formell kompetanse enn de søkte etter, etter næring. Prosent. [...] Overnattings- og serveringsvirksomhet | 9.1 | 12.6 | 21.7 [...] I alt | 10.5 | 7.6 | 18.1
    Nav (Norwegian Labour and Welfare Administration), Navs bedriftsundersøkelse 2026 - Figurer og tabeller (Figur 7)

    Published 2026-05-20 · Read 23 September 2026

    Scope: Columns: could not hire anyone | hired someone with lower/other qualifications | total. Recruitment attempts in the three months before the survey.

Damage is rare, and deadlines are strict

What this means for operators

Damage is rare, but a 14-day claim window is not negotiable. Evidence captured at every turnover is what makes the rare claim winnable.

  • Platform policy

    14 days

    Airbnb's host damage protection reimburses up to $3 million, but claims must be filed within 14 days of checkout.

    Host damage protection, part of AirCover for Hosts, reimburses Hosts up to $3 million in the rare event your place or belongings are damaged by a guest during an Airbnb stay. [...] Within 14 days of the responsible guest's checkout, file a reimbursement request in the Resolution Center.
    Airbnb, Host damage protection (Help Center article 279)

    Undated live help page (current at retrieval) · Read 23 September 2026

    Scope: Not an insurance policy; excludes Japan and Airbnb Travel LLC stays; limits in USD.

  • Company disclosure · newsroom

    0.02%

    Only about 0.02% of Airbnb reservations globally led to a property-damage reimbursement of $1,000 or more in 2022.

    Overall, the percentage of stays in 2022 globally that resulted in a safety-related report by a Host or guest was approximately 0.09 percent. That same year, approximately just 0.02 percent of reservations on Airbnb globally led to property damage reimbursement of $1000 or more.
    Airbnb, An update on our work to crack down on parties and disruptive behavior (Airbnb Newsroom)

    Published 2023-08-31 · Read 23 September 2026

    Scope: Company-reported, 2022 data. Counts only large reimbursed claims, not total damage incidents or unclaimed wear.

  • Company disclosure · newsroom

    <0.06%

    Fewer than about 0.06% of Airbnb stays in the US led to a party report in 2025.

    In 2025, fewer than approximately 0.06% of stays on Airbnb in the US resulted in a report of a party to us.
    Airbnb, Our anti-party system returns for July 4 weekend (Airbnb Newsroom)

    Published 2026-06-24 · Read 23 September 2026

    Scope: Company-reported; US only; reported parties only.

Method

  • Compiled from primary sources only: statistics offices, company filings, the survey owner’s own publication and platform policy pages.
  • Every figure is quoted as the source states it, with the publication date and the date we read it (23 September 2026).
  • Surveys show their sample where the source gives one. Vendor surveys and vendor statements are labelled as such.
  • Proptonomy’s own figures are not mixed in; they are on the research hub with their method.
  • “What this means for operators” is our analysis, not the source’s.

Scope and caveats

  • Breezeway, Hostfully and Hospitable figures are vendor surveys or vendor platform data, labelled as such.
  • BLS figures are US-only; the July 2026 quit rate is preliminary.
  • SSB wage figures are for full-time employees in the cleaner occupation group, all industries.
  • Airbnb damage and party figures are the company’s own disclosures and cover different years.

Cite this report

Please cite the primary source for any single figure (each card’s “Copy” does that), and this report when you use the collection.

APA

Proptonomy Research. (2026). Short-term rental operations and the field team, 2026. Proptonomy. https://proptonomy.ai/research/operations-and-field-team-2026

MLA

Proptonomy Research. “Short-term rental operations and the field team, 2026.” Proptonomy, 23 September 2026, https://proptonomy.ai/research/operations-and-field-team-2026.

Chicago

Proptonomy Research. “Short-term rental operations and the field team, 2026.” Proptonomy. 23 September 2026. https://proptonomy.ai/research/operations-and-field-team-2026.

Sources

  1. Breezeway, The State of Work in 2025: Short-Term Rentals Statistics and Insights from Operators (2025 State of Work Report) · 2025-09-09
  2. Hostfully, Vacation Rental Tech Stack Report 2026 · June 2026 (data as of May 2026)
  3. Hospitable, Hospitable 2026 Industry Report · January 2026 (survey fielded November 2025)
  4. US Bureau of Labor Statistics, Occupational Employment and Wage Statistics (OEWS), SOC 37-2012, via BLS Public Data API · OEWS 2025 estimates
  5. US Bureau of Labor Statistics, Occupational Employment and Wage Statistics (OEWS), industry 721100 Traveler Accommodation, via BLS Public Data API · OEWS 2025 estimates
  6. US Bureau of Labor Statistics, Job Openings and Labor Turnover Survey (JOLTS), via BLS Public Data API · July 2026 data (preliminary)
  7. Statistics Norway (SSB), Table 11418: Monthly earnings, by measuring method, occupation, sector, sex, contractual/usual working hours per week · Table updated 2026-08-28
  8. Eurostat, Labour cost levels by NACE Rev. 2 activity (dataset lc_lci_lev) · Dataset updated 2026-04-23
  9. Nav (Norwegian Labour and Welfare Administration), Navs bedriftsundersøkelse 2026 - Figurer og tabeller (Figur 7) · 2026-05-20
  10. Airbnb, Host damage protection (Help Center article 279) · Undated live help page (current at retrieval)
  11. Airbnb, An update on our work to crack down on parties and disruptive behavior (Airbnb Newsroom) · 2023-08-31
  12. Airbnb, Our anti-party system returns for July 4 weekend (Airbnb Newsroom) · 2026-06-24

Corrections to hello@proptonomy.ai · Editorial standards

Meet your new AI teammate.

See how Proptonomy can help you and your team with the everyday work of running your properties.